1.27.26 A Cold January, but the Stock Barometer Remains Positive
As a wave of inclement weather sweeps across much of the U.S., investors are also navigating a seasonally important period for markets. Much like winter storms can influence travel patterns and economic activity early in the year, January’s market performance has long been viewed as a potential signal for what lies ahead. This concept, known as the “January Barometer,” suggests that market momentum established in the opening month often carries through the remainder of the year, making the first weeks of 2026 particularly important. With both the weather and markets in flux, investors are watching closely to see if January delivers clearer skies or more turbulence ahead for stocks.
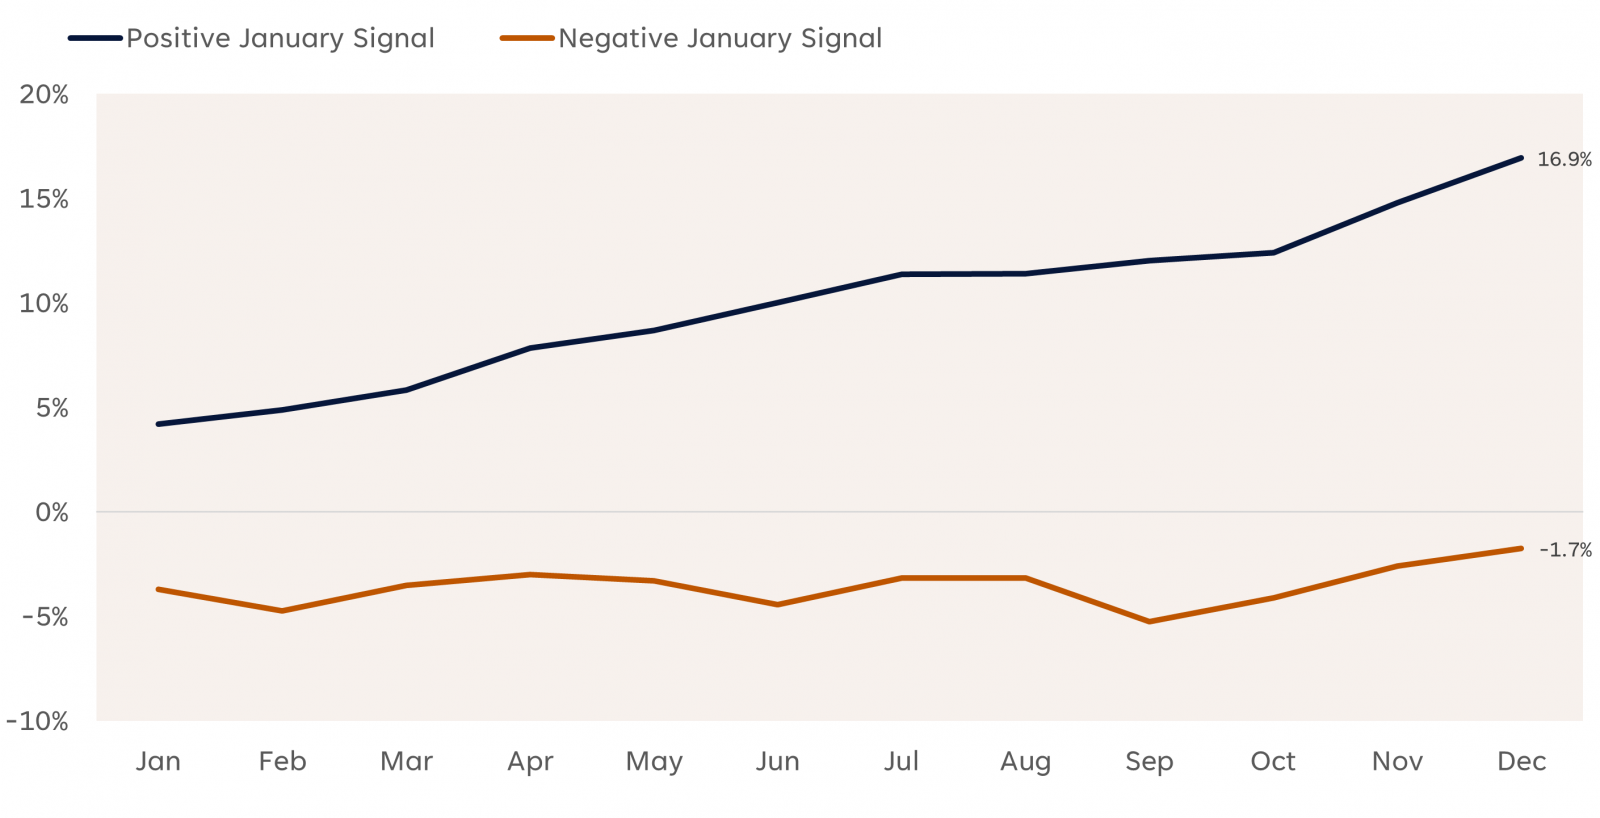
The idea traces back to Yale Hirsch, creator of the Stock Trader’s Almanac, who first identified the seasonal pattern in 1972 and famously summed it up with the phrase, “As goes January, so goes the year.” As illustrated in the chart below, this well-known Wall Street maxim has proven surprisingly durable over time. Historical data reveals several statistics that help explain why the January Barometer continues to attract attention:
• Since 1950, the S&P 500 has generated an average annual return of 16.9% in years when January finished in positive territory, with the index ending higher 89% of the time.
• By contrast, when January posted a loss, average annual returns fell to -1.7%, and stocks finished the year higher in only 50% of instances.
• Following positive Januarys, the S&P 500 has historically produced an average February through December price return of 12.2% and finished higher 87% of the time.
• When January performance has been negative, the average February through December price return drops to just 2.1%, with the market finishing the year higher 60% of the time.
• Years that began with a positive January have also experienced significantly smaller drawdowns, with an average maximum intra‑year decline of 10.5%, versus an average drawdown of 18.7% in years that started in the red.
S&P 500 Progression Based on the January Barometer (1950–2025)
- Source: LPL Research, Bloomberg, 01/26/26
- Disclosures: Past performance is no guarantee of future results. All indexes are unmanaged and can’t be invested in directly. The modern design of the S&P 500 stock index was first launched in 1957. Performance back to 1950 incorporates the performance of the predecessor index, the S&P 90.
Last week’s rebound from Tuesday’s 2% pullback lifted the S&P 500 back into positive territory for the month. Risk appetite appeared to recover, at least temporarily, as geopolitical tensions tied to Greenland eased and interest rates stabilized. As of January 26, the broader market’s 1.5% month‑to‑date gain provides some cushion heading into the final days of January trading, which concludes on Friday. That said, several notable risk events remain on the calendar, including the conclusion of the January Federal Open Market Committee (FOMC) meeting tomorrow, where a pause in monetary policy (no change in rates) is widely anticipated. Earnings season will also be in full swing, with more than 100 S&P 500 companies reporting this week, including Apple (AAPL), Meta (META), Microsoft (MSFT), and Tesla (TSLA). For the S&P 500, a close above 6,845.50 on Friday would confirm a positive January Barometer signal.
It is important to remember that seasonal trends reflect historical tendencies, not guarantees of future outcomes. These patterns do not account for underlying fundamentals such as earnings results, shifts in monetary or fiscal policy expectations, evolving economic conditions, or geopolitical developments.
- Important Disclosures
- This material is for general information only and is not intended to provide specific advice or recommendations for any individual. There is no assurance that the views or strategies discussed are suitable for all investors. To determine which investment(s) may be appropriate for you, please consult your financial professional prior to investing.
- Investing involves risks including possible loss of principal. No investment strategy or risk management technique can guarantee return or eliminate risk.
- Indexes are unmanaged and cannot be invested into directly. Index performance is not indicative of the performance of any investment and does not reflect fees, expenses, or sales charges. All performance referenced is historical and is no guarantee of future results.
- This material was prepared by LPL Financial, LLC. All information is believed to be from reliable sources; however LPL Financial makes no representation as to its completeness or accuracy.
- Unless otherwise stated LPL Financial and the third party persons and firms mentioned are not affiliates of each other and make no representation with respect to each other. Any company names noted herein are for educational purposes only and not an indication of trading intent or a solicitation of their products or services.
- Asset Class Disclosures –
- International investing involves special risks such as currency fluctuation and political instability and may not be suitable for all investors. These risks are often heightened for investments in emerging markets.
- Bonds are subject to market and interest rate risk if sold prior to maturity.
- Municipal bonds are subject and market and interest rate risk and potentially capital gains tax if sold prior to maturity. Interest income may be subject to the alternative minimum tax. Municipal bonds are federally tax-free but other state and local taxes may apply.
- Preferred stock dividends are paid at the discretion of the issuing company. Preferred stocks are subject to interest rate and credit risk. They may be subject to a call features.
- Alternative investments may not be suitable for all investors and involve special risks such as leveraging the investment, potential adverse market forces, regulatory changes and potentially illiquidity. The strategies employed in the management of alternative investments may accelerate the velocity of potential losses.
- Mortgage backed securities are subject to credit, default, prepayment, extension, market and interest rate risk.
- High yield/junk bonds (grade BB or below) are below investment grade securities, and are subject to higher interest rate, credit, and liquidity risks than those graded BBB and above. They generally should be part of a diversified portfolio for sophisticated investors.
- Precious metal investing involves greater fluctuation and potential for losses.
- The fast price swings of commodities will result in significant volatility in an investor's holdings.
- This research material has been prepared by LPL Financial LLC.
- Not Insured by FDIC/NCUA or Any Other Government Agency | Not Bank/Credit Union Deposits or Obligations | Not Bank/Credit Union Guaranteed | May Lose Value
- Tracking: #1055246
Contact us directly should you have questions about this topic.