3.3.26 Risk-On Appetite Strong in 2026: Fund Flows Recap
With February behind us, we conducted a deeper dive into exchange-traded fund (ETF) flows over the month and year-to-date (YTD) periods. Flows measure the net movement of cash into and out of investment vehicles, such as mutual funds and exchange-traded funds (ETF). We analyzed flows to gain insight on investor demand and sentiment surrounding asset classes, sectors, and other segments of markets.
Broad Asset Class Flows
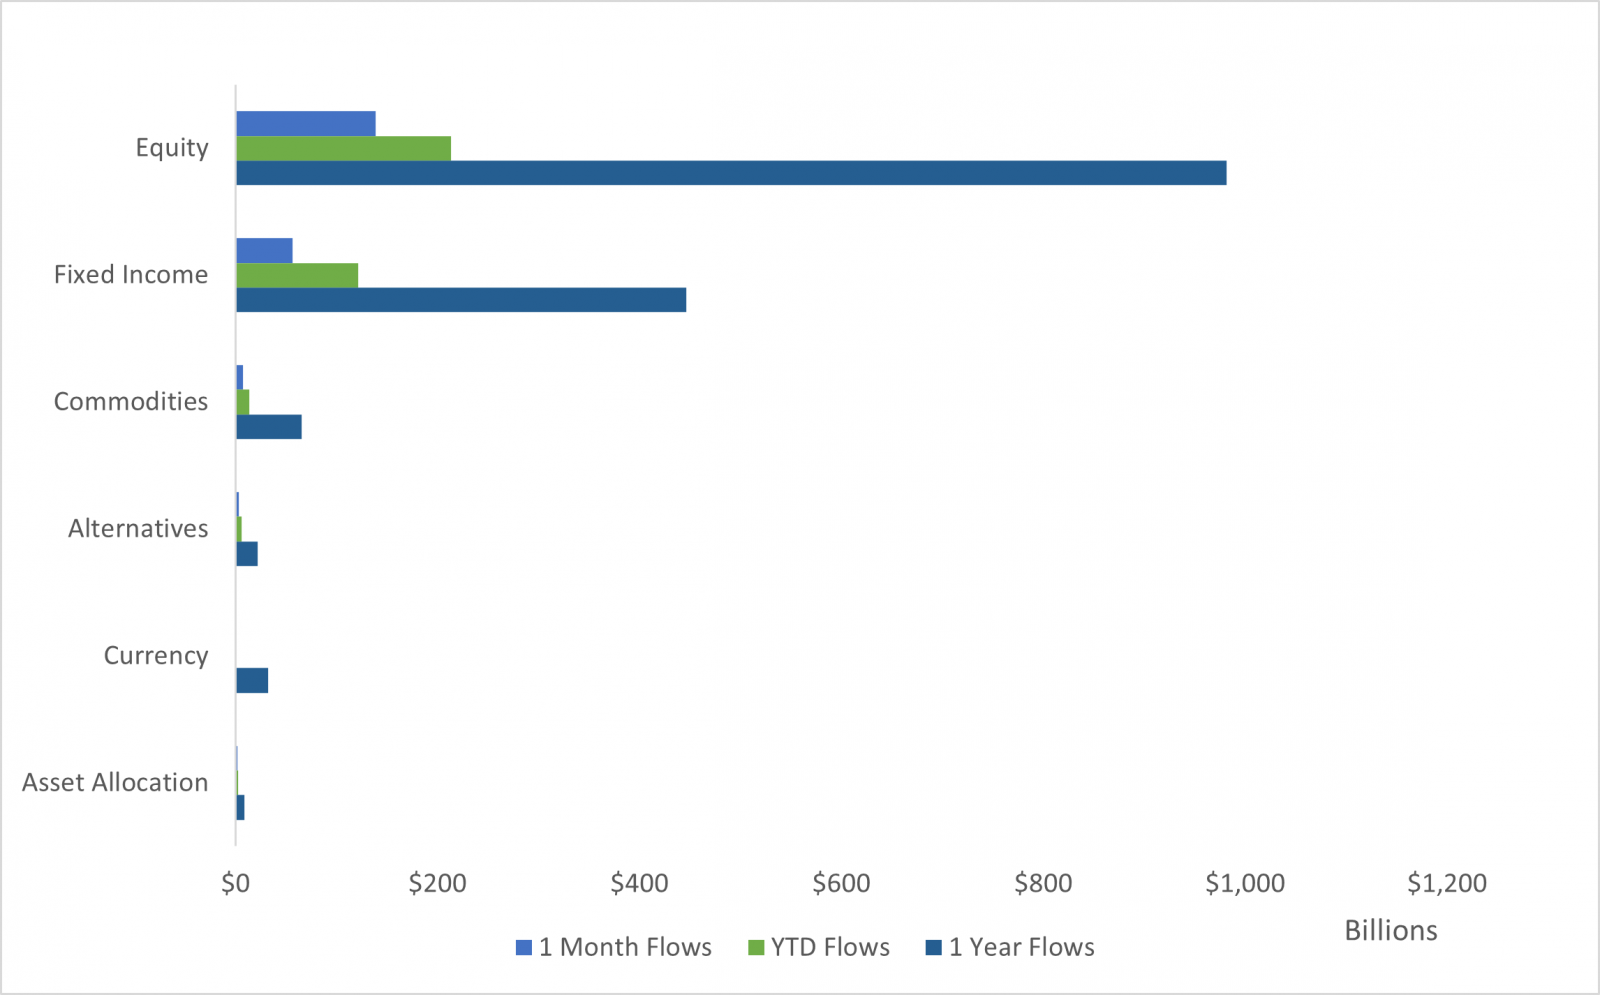
At the broad asset class level, investors continued to pour into equity ETFs, which now represent 78% (~$11 trillion) of the total ETF market, with February realizing a net flow of $139 billion, putting the YTD flows at $214 billion. Despite the volatility, with the S&P 500 marginally up at 0.7% to start the year following a slight drawdown in February (-0.8%), capital continues to pile into stocks. The artificial intelligence (AI) trade that propelled equities higher over the last few years has begun to unwind with stocks in more AI-oriented industries (and some others threatened by AI cannibalizing their industries) leading markets lower. While some view the AI drawdown as a buying opportunity, others see cracks in the AI buildout starting to reverberate across other segments of the market. Nonetheless, stocks continue to see strong flows and have brought in nearly a trillion in assets over the trailing one-year period at month-end.
Fixed income, following a strong 2025 as measured by the Bloomberg U.S. Aggregate Bond Index (AGG) rising 7.3%, saw meaningful flows in February at $57 billion, bringing the YTD total to $122 billion. Fixed income ETFs represent nearly 17% ($2.4 trillion) of the total ETF market, or roughly a quarter the size of the equity ETF market – combined they represent 95% of ETF assets. Although they are overshadowed by the equity market, they continue to punch above their weight by gathering more assets on a relative size basis. Despite the Federal Reserve’s (Fed) decision to lower interest rates three times in 2025, bonds continue to have an attractive yield relative to history and we believe core bonds (Treasurys, investment-grade corporate bonds, and mortgage-backed securities (MBS)) in particular represent an equally attractive risk-reward trade-off as equities. Investors looking to escape equity market volatility have been rewarded moving into the generally steadier, less volatile asset class.
Across diversifying strategies, including commodities, alternative investments, currencies and allocation ETFs, commodities was the standout amassing $7.7 billion in assets in February, with YTD flows closing out the month at $13.6 billion. Commodities represent nearly 3% of the ETF marketplace with $417 billion in assets. One of the largest segments of the commodity market is precious metals, with gold being the dominant metal by market size and volume. Gold surged in 2025, rising over 50%, as its safe haven status intrigued investors facing increased geopolitical uncertainty, expectations of lower interest rates (lower yields reduce the opportunity cost of holding gold), and a weaker U.S dollar (USD) (USD weakness increased the purchasing power of gold). The other diversifying strategies (alternatives, currency, and allocation) saw mixed flows over the month, with alternatives and allocation strategies gaining nearly $3.3 billion and $1.9 billion, respectively, and currency (which includes digital currencies) realizing an outflow of $1.6 billion – not surprising given the significant sell-off in digital assets, most notably Bitcoin (BTC) slashing nearly half its value since October’s all-time high.
Investors Remain Risk-On Despite Choppy Equity Markets
Trailing one-month, YTD, and one-year Net Asset Flows Across Broad Asset Classes (AUM, Billions $)
- Source: LPL Research, Factset, 2/27/26
- Disclosures: Indexes are unmanaged and cannot be invested in directly. Past performance is no guarantee of future results.
Asset Class Specific Flows
Equities
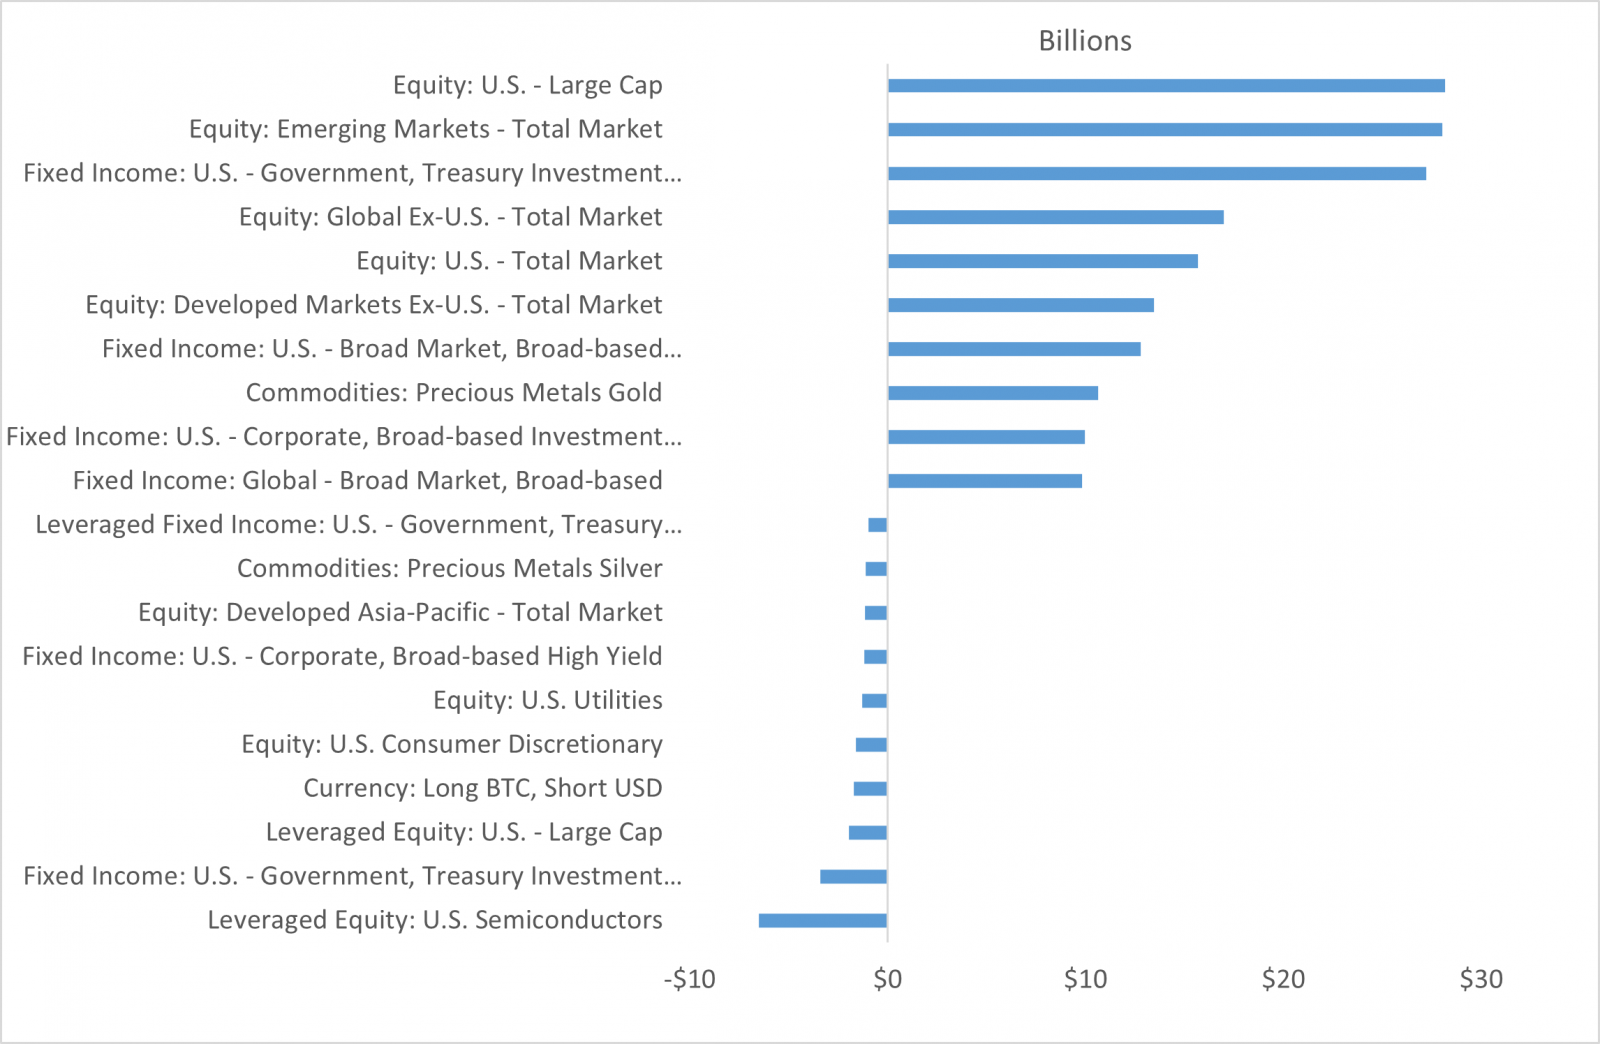
Within equities, U.S. large cap equities was the largest equity segment by flows over the month and YTD periods, gathering $24.7 billion and $28.2 billion, respectively. U.S. large cap equities dwarf all other segments in terms of assets at $3.7 trillion, representing nearly 26% of the ETF market, with the next closest segment (U.S. total market) at $1.3 trillion (~9%). While volatility has increased, leading investors to rotate out of high-flying growth stocks and into more defensive value stocks, domestic markets continue to benefit from AI, impressive corporate earnings, and the potential for lower interest rates and fiscal policy stimulus. Following U.S. large cap was emerging market (EM) equities, gathering nearly $13 billion and $28 billion over the month and YTD periods, respectively. Despite being the sixth largest segment by assets ($401 billion) – slightly more than a tenth the size of the U.S. large cap equities – according to the MSCI EM Index, EM experienced a stellar 2025, up over 30%, and a strong 2026 thus far, up 15%, as investors continue to pour into the region. EM equities have benefited from the weaker USD, solid growth and robust manufacturing (notably in the AI buildout), and its relative discount to developed market equities from a valuation perspective.
What’s notable in equities is the amount of capital flowing into non-U.S. equities. As previously mentioned, emerging market equities received the second largest influx of capital over the month and YTD period, but what’s also significant is the money that’s moved into global ex-US total market and developed market ex-US equities, ranking third and fourth, respectively over the trailing one-month period. Despite a strong year from domestic stocks in 2025, with the S&P 500 up nearly 18%, most foreign equity markets were up 30% or more, as seen with the MSCI EM and MSCI EAFE indexes, and with investors most likely chasing performance.
At the other end of the spectrum are sector specific ETFs, such as financials, information technology, utilities, consumer discretionary, and leveraged equity: semiconductors – all ranking in the bottom 10 flows by segment YTD. Within information technology lies the software industry, which has sold off meaningfully as the threat of AI begins to weigh on market valuations. Semiconductors, also in the information technology sector, have held up better, up 1.4% on the year. The selling of some leveraged semiconductor ETFs could be the result of the broader sentiment towards AI as investors have grown weary the emerging technology will not live up to expectations.
Fixed Income
In fixed income, core bond categories such as U.S. broad market investment grade bonds, ultra-short Treasurys, and U.S. corporate investment grade bonds all ranked in the top 10 by segment in trailing one-month flows, ranking seventh, eighth, and tenth respectively. While bonds represent a smaller proportion of ETF markets (17% vs. equities at 78%), they continue to attract investor capital, closing the gap, albeit marginally, on their equity peers. Not all bond segments fared well though – global bank loans, which recently have been exposed to the drawdown in private credit markets on AI disruption fears – experienced some of the largest outflows in February, losing over $2.2 billion in assets.
Diversifying Strategies
Across diversifying strategies, as noted earlier, gold continues its strong run from 2025, ranking as the eighth largest segment YTD in terms of flows, gaining $10.6 billion in assets. Although gold is a much smaller segment of the broader ETF market (2.3%), it’s consistently ranked in the top 10 segments by monthly flows as investors look to diversify from traditional stocks and bonds.
Contrarily, while not a traditional fiat currency, digital assets have continued to see significant outflows as investors rotate away from highly speculative assets. The long BTC, short USD segment has realized the second and fourth most outflows over the trailing one month and YTD periods, respectively.
While small in size, alternatives broadly have seen positive flows, with downside protection ETFs, or sometimes referred to as “buffer” ETFs, becoming more popular amongst investors as they try to protect their portfolios from drawdown risk with heightened volatility. Additionally, traditional hedge fund strategies, such as global macro, event driven, and managed futures, which are now being offered in ETF vehicles (although with stringent restrictions to stay within regulatory compliance), continue to gain assets. Collectively, these alternative strategies can be seen as defensive positions that offer uncorrelated return streams to traditional equities and fixed income.
Foreign Equities, Core Fixed Income Dominate YTD Flows
Trailing YTD Net Asset Flows across Factset Segment (AUM, $ Billions)
- Source: LPL Research, Factset, 2/27/26
- Disclosures: Indexes are unmanaged and cannot be invested in directly. Past performance is no guarantee of future results.
Key Tactical Asset Allocation Takeaways
When comparing the latest LPL Research Strategic and Tactical Asset Allocation Committee (STAAC) views with the February flows data, there are a number of similarities. The STAAC continues to like the top asset class by assets and YTD flows, U.S. large caps. The STAAC maintains an overweight to large/mid cap equities over small, with a tilt towards large/mid growth over small value. Large/mid growth equities continue to benefit from strong technology-driven earnings, helping justify lofty valuations; however, recent underperformance and negative technicals have led to a slightly more negative bias on the asset class. Regionally, the STAAC has been warming up to the second highest segment by flows YTD, emerging market equities, on improving fundamentals and technicals, but remain neutral from a geographic perspective between U.S, developed international, and emerging markets.
Within fixed income, the STAAC prefers core bond sectors over spread sectors as historically tight spreads make the relative risk-return profile of spread sectors less attractive. Outside of traditional stocks and bonds, the STAAC maintains an allocation to alternative investments, specifically in global macro and multi-strategy funds. From a sector perspective, the STAAC is overweight the communication services sector, which ranked in the middle by sector inflows YTD. The growth outlook in communication services remains solid and valuations are reasonable, although technical analysis conditions have softened leading to a negative bias on the sector.
The information presented is for educational and informational purposes only and is not intended as a recommendation or specific advice. Cryptocurrency and cryptocurrency-related products can be volatile, are highly speculative and involve significant risks including: liquidity, pricing, regulatory, cybersecurity risk, and loss of principal. A cryptocurrency fund may trade at a significant premium to Net Asset Value (NAV). Cryptocurrencies are not legal tender and are not government backed. Cryptocurrencies are non-traditional investments, resulting in a different tax treatment than currency. Federal, state or foreign governments may restrict the use and exchange of cryptocurrency. The use and exchange of cryptocurrency may also be restricted or halted permanently as regulatory developments continue, and regulations are subject to change at any time. Cryptocurrency exchanges may stop operating or permanently shut down due to fraud, technical glitches, hackers, malware, or bankruptcy.
- Important Disclosures
- This material is for general information only and is not intended to provide specific advice or recommendations for any individual. There is no assurance that the views or strategies discussed are suitable for all investors. To determine which investment(s) may be appropriate for you, please consult your financial professional prior to investing.
- Investing involves risks including possible loss of principal. No investment strategy or risk management technique can guarantee return or eliminate risk.
- Indexes are unmanaged and cannot be invested into directly. Index performance is not indicative of the performance of any investment and does not reflect fees, expenses, or sales charges. All performance referenced is historical and is no guarantee of future results.
- This material was prepared by LPL Financial, LLC. All information is believed to be from reliable sources; however LPL Financial makes no representation as to its completeness or accuracy.
- Unless otherwise stated LPL Financial and the third party persons and firms mentioned are not affiliates of each other and make no representation with respect to each other. Any company names noted herein are for educational purposes only and not an indication of trading intent or a solicitation of their products or services.
- Asset Class Disclosures –
- International investing involves special risks such as currency fluctuation and political instability and may not be suitable for all investors. These risks are often heightened for investments in emerging markets.
- Bonds are subject to market and interest rate risk if sold prior to maturity.
- Municipal bonds are subject and market and interest rate risk and potentially capital gains tax if sold prior to maturity. Interest income may be subject to the alternative minimum tax. Municipal bonds are federally tax-free but other state and local taxes may apply.
- Preferred stock dividends are paid at the discretion of the issuing company. Preferred stocks are subject to interest rate and credit risk. They may be subject to a call features
- Alternative investments may not be suitable for all investors and involve special risks such as leveraging the investment, potential adverse market forces, regulatory changes and potentially illiquidity. The strategies employed in the management of alternative investments may accelerate the velocity of potential losses.
- Mortgage backed securities are subject to credit, default, prepayment, extension, market and interest rate risk.
- High yield/junk bonds (grade BB or below) are below investment grade securities, and are subject to higher interest rate, credit, and liquidity risks than those graded BBB and above. They generally should be part of a diversified portfolio for sophisticated investors.
- Precious metal investing involves greater fluctuation and potential for losses.
- The fast price swings of commodities will result in significant volatility in an investor's holdings.
- This research material has been prepared by LPL Financial LLC.
- Not Insured by FDIC/NCUA or Any Other Government Agency | Not Bank/Credit Union Deposits or Obligations | Not Bank/Credit Union Guaranteed | May Lose Value
- For Public Use – Tracking: #1072278
Contact us directly should you have questions about this topic.