3.31.26 Technical Perspective on the Current Drawdown
As the first quarter comes to a close, it’s clear that equity markets have endured a difficult stretch. The strong momentum that drove a record‑setting rally early in the year faded quickly as concerns over artificial intelligence (AI) spending and disruption dampened risk appetite. The outbreak of the Iran war in late February added new challenges, as the essential closure of the Strait of Hormuz underpinned an unprecedented supply shock in oil that quickly drove prices to multi-year highs. Inflation fears promptly followed, and the market drastically repriced global monetary policy expectations to a higher-for-longer regime, with growing probabilities for tightening among major central banks (including the Federal Reserve).
With markets now hinging on when the U.S.‑Iran conflict might be resolved and when the Strait will fully reopen, uncertainty remains the dominant force. The longer the conflict persists, the greater the potential strain on global growth, inflation, interest rates, earnings, profit margins, and ultimately equity markets.
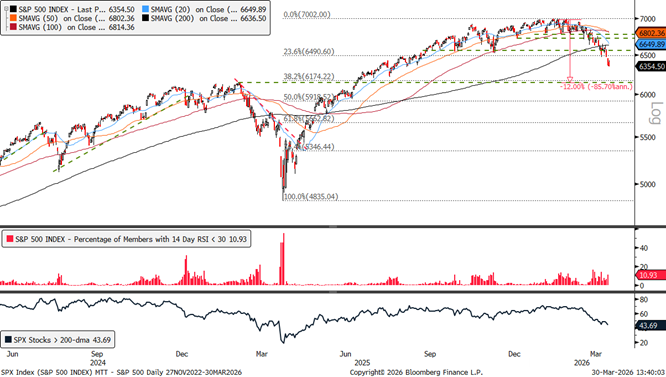
Stocks have struggled against this challenging backdrop. The S&P 500 posted its fifth straight weekly decline last week and is now inching toward correction territory, technically defined by a drawdown of 10–20%. Technical damage has been significant as the index broke below its closely watched 200-day moving average (dma) and the November lows at 6,522. This leaves 6,174 (a key Fibonacci retracement level of the April–January advance) and the February highs at 6,144 as the next major downside support levels to watch.
The consistent pattern of lower highs and lower lows over the past two months has turned near-term momentum gauges bearish. Although oversold conditions are starting to emerge, most indicators have yet to reach the extreme levels that typically signal contrarian buying opportunities. For instance, only about 11% of S&P 500 stocks registered oversold Relative Strength Index (RSI) readings on Friday, well below the +50% seen last April or the +20% levels observed during previous market corrections in recent years.
Selling pressure has also been widespread, and market internals continue to deteriorate. Only 43% of S&P 500 constituents remain above support from their November lows, with a similar share still holding above their 200-dma. Breadth composition is also concerning, as defensive sectors have taken leadership. Technology, the market’s largest weight, has rolled over, while financials and consumer discretionary sit among the weakest areas in our technical work. A durable recovery will require renewed risk appetite across these sectors, along with meaningful technical improvements.
Technical Deterioration Points to Near-Term Downside Risk
- Source: LPL Research, Bloomberg 03/30/26
- Disclosures: Indexes are unmanaged and cannot be invested in directly. Past performance is no guarantee of future results.
Historical Perspective
Taking a step back to a longer‑term (and more encouraging) perspective, the secular uptrend supporting this bull market remains firmly in place. History also offers reassurance when it comes to geopolitical shocks. As we noted in our March 9 Weekly Market Commentary (Markets Tested as Iran Conflict Continues), “The stock market has demonstrated remarkable resilience in the face of major geopolitical shocks in the past.” Our analysis of more than 80 years of market reactions to 26 distinct geopolitical events shows that the S&P 500 has historically gained an average of 7.8% in the 12 months following such events and finished higher 68% of the time, although past performance does not guarantee future results.
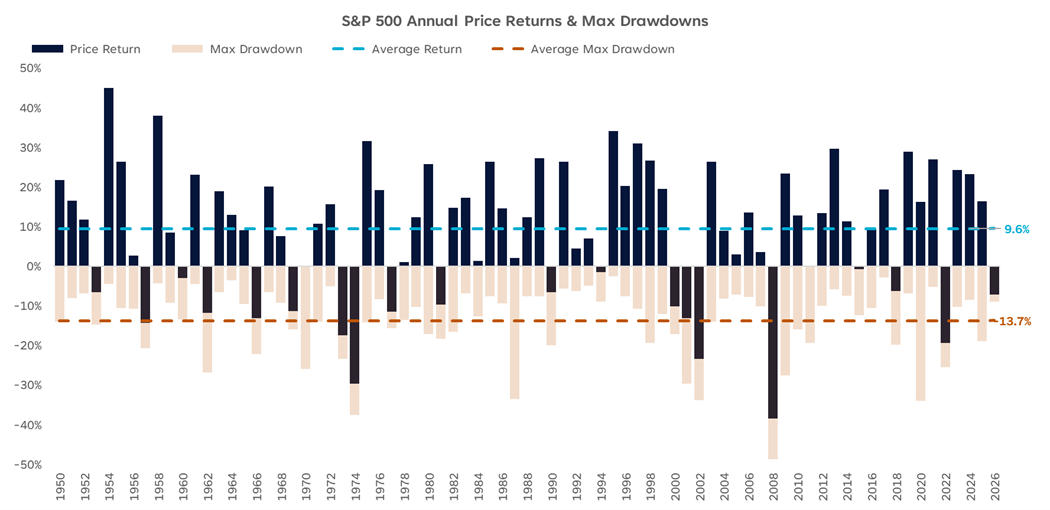
Although drawdowns can feel uncomfortable, particularly following the low‑volatility environment that characterized the start of the year, they should not catch investors off guard. Over the past 75 years, the S&P 500’s average peak‑to‑trough intra‑year pullback has been ‑13.7%. More importantly, despite these declines, the index has delivered an average annual price gain of 9.6%, with positive returns in 74% of those years. As illustrated in the “Bull Markets Are Not Linear” chart, even sizable drawdowns have not necessarily translated to down years. Last year serves as a clear example: equity markets fell nearly 20% in April amid tariff‑related concerns, but as those fears eased and trade policy softened, investor focus shifted back to fundamentals like earnings and economic growth, which helped drive a strong recovery.
Bull Markets Are Not Linear
- Source: LPL Research, Bloomberg 03/30/26
- Disclosures: Past performance is no guarantee of future results. All indexes are unmanaged and can’t be invested in directly. The modern design of the S&P 500 stock index was first launched in 1957. Performance back to 1950 incorporates the performance of the predecessor index, the S&P.
Frequency of Drawdowns
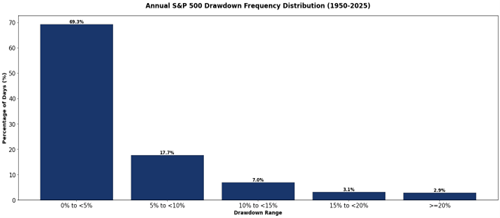
A bull market can sometimes cause investors to forget that drawdowns are not anomalies, they are a normal and frequent part of market behavior. Outside of periods when stocks are setting new record highs, the market is almost always experiencing some degree of pullback. Historically, on a calendar‑year basis, the S&P 500 has spent nearly 70% of trading days in a drawdown of up to 5% and roughly 18% of trading days in a 5–10% drawdown range. Investors may find it reassuring that deeper declines are far less common, as illustrated in the “Drawdowns Should Be Expected” chart.
Drawdowns Should Be Expected
- Source: LPL Research, Bloomberg 03/30/26
- Disclosures: Past performance is no guarantee of future results. All indexes are unmanaged and can’t be invested in directly. The modern design of the S&P 500 stock index was first launched in 1957. Performance back to 1950 incorporates the performance of the predecessor index, the S&P.
Conclusion
Equity markets continue to grapple with mounting near‑term pressures and technical conditions have undeniably weakened. The recent supply‑driven spike in oil prices, rising inflation concerns, and geopolitical uncertainty have all contributed to growing downside risk over the weeks ahead. These forces may keep volatility elevated and leave markets vulnerable to additional corrective price action in the short run.
However, it’s equally important to recognize that the longer‑term backdrop has not fundamentally changed. The secular uptrend supporting this bull market is still intact, and history demonstrates that periodic drawdowns are a routine feature of equity markets rather than a clear signal of imminent long-term destruction. As highlighted earlier, the S&P 500 has spent the vast majority of its trading history in some degree of drawdown, with sizable peak‑to‑trough declines occurring even in years that ultimately delivered strong positive returns. This perspective reinforces the idea that short‑term weakness can coexist with resilient long‑term trends. Please note that past performance does not guarantee future results.
In our view, as long as fundamentals remain reasonably solid and the technical foundation of the longer‑term trend holds, periods of market stress should be viewed through a measured lens. Near‑term downside risks have increased, but the longer‑term technical and fundamental backdrop provide an encouraging counterbalance, in our view.
- Important Disclosures
- This material is for general information only and is not intended to provide specific advice or recommendations for any individual. There is no assurance that the views or strategies discussed are suitable for all investors. To determine which investment(s) may be appropriate for you, please consult your financial professional prior to investing.
- Investing involves risks including possible loss of principal. No investment strategy or risk management technique can guarantee return or eliminate risk.
- Indexes are unmanaged and cannot be invested into directly. Index performance is not indicative of the performance of any investment and does not reflect fees, expenses, or sales charges. All performance referenced is historical and is no guarantee of future results.
- This material was prepared by LPL Financial, LLC. All information is believed to be from reliable sources; however LPL Financial makes no representation as to its completeness or accuracy.
- Unless otherwise stated LPL Financial and the third party persons and firms mentioned are not affiliates of each other and make no representation with respect to each other. Any company names noted herein are for educational purposes only and not an indication of trading intent or a solicitation of their products or services.
- Asset Class Disclosures –
- International investing involves special risks such as currency fluctuation and political instability and may not be suitable for all investors. These risks are often heightened for investments in emerging markets.
- Bonds are subject to market and interest rate risk if sold prior to maturity.
- Municipal bonds are subject and market and interest rate risk and potentially capital gains tax if sold prior to maturity. Interest income may be subject to the alternative minimum tax. Municipal bonds are federally tax-free but other state and local taxes may apply.
- Preferred stock dividends are paid at the discretion of the issuing company. Preferred stocks are subject to interest rate and credit risk. They may be subject to a call features.
- Alternative investments may not be suitable for all investors and involve special risks such as leveraging the investment, potential adverse market forces, regulatory changes and potentially illiquidity. The strategies employed in the management of alternative investments may accelerate the velocity of potential losses.
- Mortgage backed securities are subject to credit, default, prepayment, extension, market and interest rate risk.
- High yield/junk bonds (grade BB or below) are below investment grade securities, and are subject to higher interest rate, credit, and liquidity risks than those graded BBB and above. They generally should be part of a diversified portfolio for sophisticated investors.
- Precious metal investing involves greater fluctuation and potential for losses.
- The fast price swings of commodities will result in significant volatility in an investor's holdings.
- This research material has been prepared by LPL Financial LLC.
- Not Insured by FDIC/NCUA or Any Other Government Agency | Not Bank/Credit Union Deposits or Obligations | Not Bank/Credit Union Guaranteed | May Lose Value
- For Public Use – Tracking: #1086293
Contact us directly should you have questions about this topic.