4.30.26 Sell in May and Go Away? Maybe Not
The sharp rebound from the March lows has pushed most major equity indexes back to record highs. This upside momentum has been fueled in part by signs of de-escalation with Iran and growing expectations that the Strait of Hormuz could reopen soon. While the geopolitical environment remains fluid on a day-to-day basis, markets appear to be assigning a higher probability to a relatively near-term U.S. exit from the Middle East, alongside a normalization in global supply chains that could ultimately pressure oil prices lower.
Heading into month-end, the S&P 500 is up 9.2% as of April 29, putting it on pace for its strongest April performance since 2020. Support for equities has also come from solid first-quarter earnings and economic data that have shown limited signs of deterioration.
However, not all markets are sending the same signal. The physical oil market continues to reflect the risk of a “higher-for-longer” regime, suggesting tighter underlying supply conditions (a theme we explored further in Paper vs. Physical: What Tighter Oil Supplies Could Mean). The fixed income market also paints a similar story of lingering inflation risk as Treasury yields remain uncomfortably high. Although it's important to note, yields have been less responsive to higher oil prices this month versus last month.
May Seasonality: Weak History, Strong Recent Trends
As the calendar turns to May, seasonal trends re-enter the conversation. Historically, May has been a relatively lackluster month for equities. Since 1950, the S&P 500 has delivered an average return of just 0.4% and finished higher 62% of the time, ranking as the fifth-weakest month of the year when it comes to returns.
More recently, however, the data tells a different story. Since 2013, May has averaged a stronger 1.5% return, with 12 of the past 13 years ending in positive territory. This suggests that while long-term trends remain subdued, recent performance has been far more constructive.
Sell in May and Go Away?
May also marks the beginning of the market’s traditionally weakest six-month period, lending support to the well-known “Sell in May and Go Away” adage. This phrase originated in London as “Sell in May and go away, come back on St. Leger’s Day,” referencing a historic horse race dating back to 1776. The idea suggests investors should step away from equities during the summer months and re-enter the market in November, when conditions have historically been more favorable.
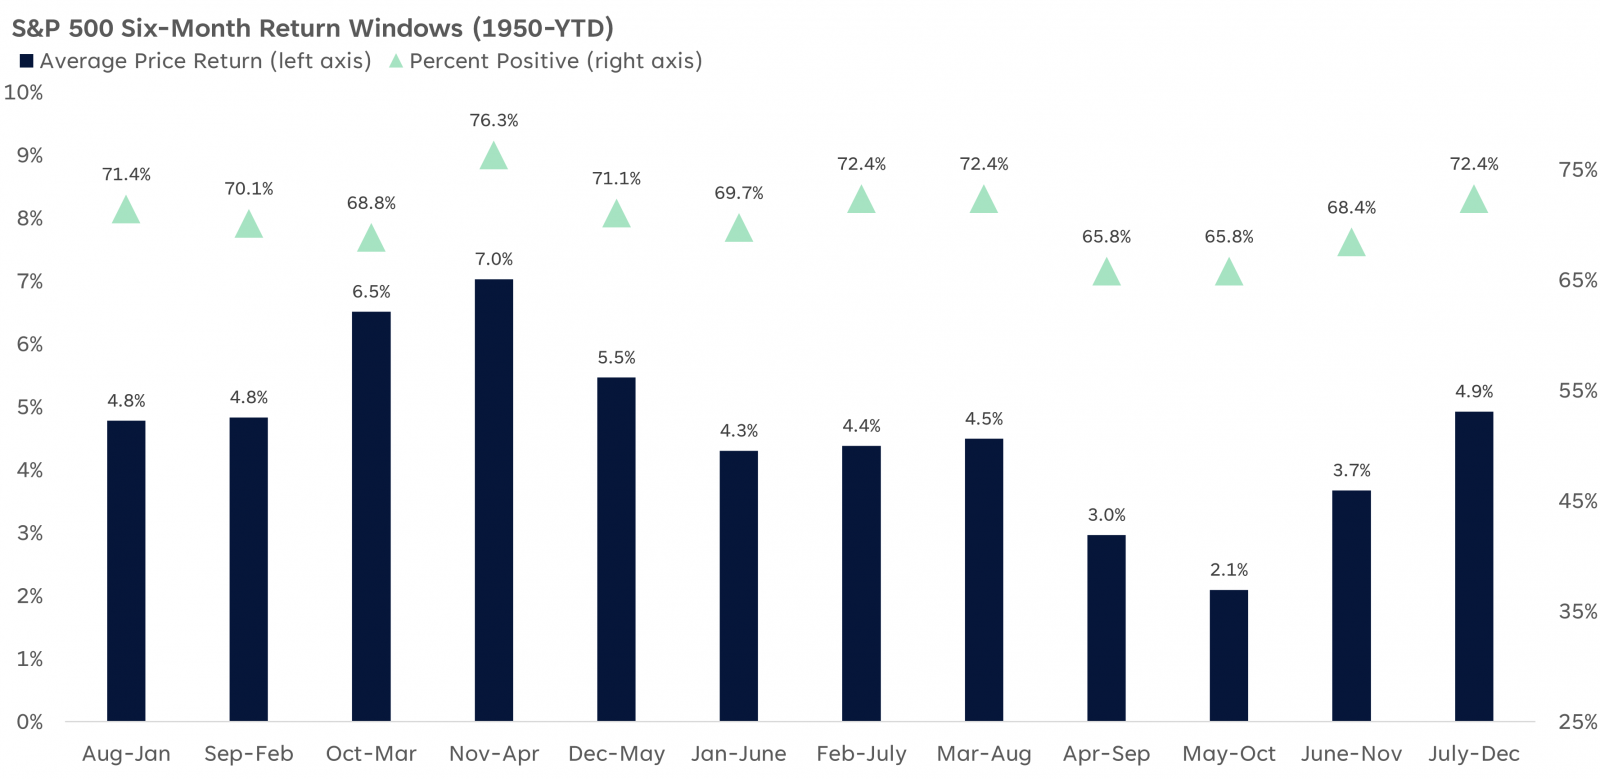
The popularity of this saying likely stems from both its simplicity and the data behind it. Since 1950, the May–October period has produced the weakest six-month returns for the S&P 500, while November–April has been the strongest. Over time, this pattern, combined with the phrase’s widespread recognition, may have contributed to a degree of self-fulfilling behavior in markets.
Still, it’s important to keep this in perspective. While May through October has historically delivered a modest average gain of 2.1%, returns have been positive roughly two-thirds of the time over this period. More recently, performance has been even stronger. Over the past 12 years, median and average returns during this period were 6.3% and 5.1%, respectively, with positive outcomes in 82% of cases.
May–October Returns Tend To Be Underwhelming but Positive
- Source: LPL Research, Bloomberg 04/29/26
- Disclosures: Past performance is no guarantee of future results. All indexes are unmanaged and can’t be invested in directly. The modern design of the S&P 500 stock index was first launched in 1957. Performance back to 1950 incorporates the performance of the predecessor index, the S&P 90.
Despite these seasonal trends, LPL Research does not advocate for investors to exit equities during this period. However, ongoing geopolitical uncertainty, particularly surrounding Iran, and its implications for growth and inflation are likely to keep volatility elevated. The reopening of the Strait of Hormuz, while potentially positive, introduces second-order effects that remain difficult to quantify at this stage.
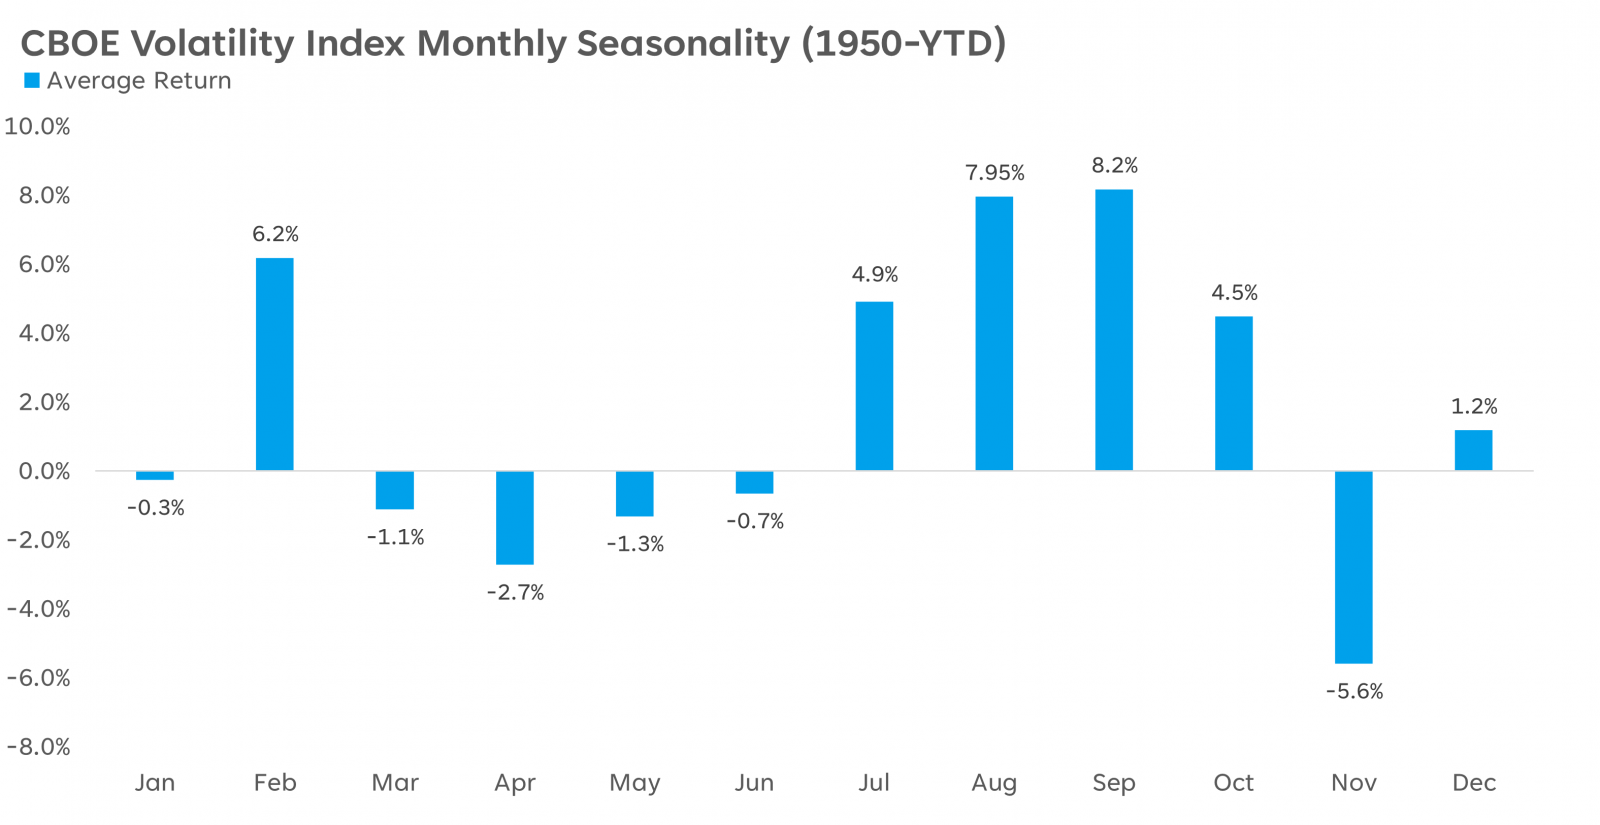
History also supports the expectation of increased volatility in the months ahead. The CBOE Volatility Index (VIX), often referred to as the market’s “fear gauge,” has historically trended higher from July through October, typically peaking in late September or early October. The VIX measures expected 30-day volatility based on S&P 500 options pricing; higher readings generally reflect increased uncertainty and risk aversion.
Volatility Tends To Ramp Up Into the Fall
- Source: LPL Research, Bloomberg 04/29/26
- Disclosures: Past performance is no guarantee of future results. All indexes are unmanaged and can’t be invested in directly.
Summary
Seasonal patterns can offer useful historical perspective, but they aren’t always a reliable guide for what lies ahead. Market direction will depend more on current forces, particularly geopolitical developments and oil prices, along with key fundamentals such as earnings, economic growth, inflation, the labor market, and monetary policy. An easing of tensions in the Middle East and a pullback in oil prices could provide ongoing support for equities, especially if earnings remain resilient.
- Important Disclosures
- This material is for general information only and is not intended to provide specific advice or recommendations for any individual. There is no assurance that the views or strategies discussed are suitable for all investors. To determine which investment(s) may be appropriate for you, please consult your financial professional prior to investing.
- Investing involves risks including possible loss of principal. No investment strategy or risk management technique can guarantee return or eliminate risk.
- Indexes are unmanaged and cannot be invested into directly. Index performance is not indicative of the performance of any investment and does not reflect fees, expenses, or sales charges. All performance referenced is historical and is no guarantee of future results.
- This material was prepared by LPL Financial, LLC. All information is believed to be from reliable sources; however LPL Financial makes no representation as to its completeness or accuracy.
- Unless otherwise stated LPL Financial and the third party persons and firms mentioned are not affiliates of each other and make no representation with respect to each other. Any company names noted herein are for educational purposes only and not an indication of trading intent or a solicitation of their products or services.
- Asset Class Disclosures –
- International investing involves special risks such as currency fluctuation and political instability and may not be suitable for all investors. These risks are often heightened for investments in emerging markets.
- Bonds are subject to market and interest rate risk if sold prior to maturity.
- Municipal bonds are subject and market and interest rate risk and potentially capital gains tax if sold prior to maturity. Interest income may be subject to the alternative minimum tax. Municipal bonds are federally tax-free but other state and local taxes may apply.
- Preferred stock dividends are paid at the discretion of the issuing company. Preferred stocks are subject to interest rate and credit risk. They may be subject to a call features.
- Alternative investments may not be suitable for all investors and involve special risks such as leveraging the investment, potential adverse market forces, regulatory changes and potentially illiquidity. The strategies employed in the management of alternative investments may accelerate the velocity of potential losses.
- Mortgage backed securities are subject to credit, default, prepayment, extension, market and interest rate risk.
- High yield/junk bonds (grade BB or below) are below investment grade securities, and are subject to higher interest rate, credit, and liquidity risks than those graded BBB and above. They generally should be part of a diversified portfolio for sophisticated investors.
- Precious metal investing involves greater fluctuation and potential for losses.
- The fast price swings of commodities will result in significant volatility in an investor's holdings.
- This research material has been prepared by LPL Financial LLC.
- Not Insured by FDIC/NCUA or Any Other Government Agency | Not Bank/Credit Union Deposits or Obligations | Not Bank/Credit Union Guaranteed | May Lose Value
- For Public Use – Tracking: #1100416