
9.24.26 The Message From Market Breadth
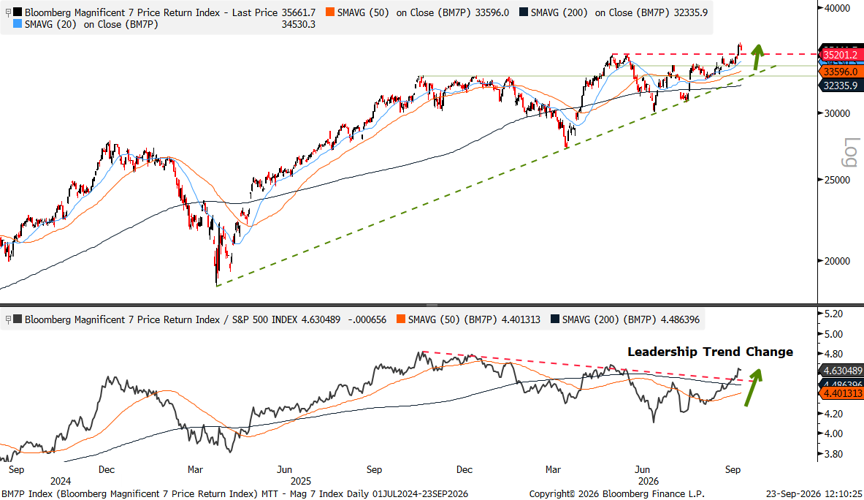
The S&P 500 has remained remarkably resilient in the face of mounting macro headwinds. Despite oil prices topping $100 per barrel, 10-year Treasury yields climbing above 5%, and a renewed shift toward tighter monetary policy, the index continues to hover near record levels. Much of that resilience can be attributed to the resurgence of mega-cap stocks. After significant underperformance in the first quarter, the Magnificent Seven Index, comprised of Alphabet (GOOG/L), Amazon (AMZN), Apple (AAPL), Meta (META), Microsoft (MSFT), NVIDIA (NVDA), and Tesla (TSLA), has staged an impressive comeback, powering the index back to record-high territory and reclaiming leadership relative to the broader market.
Mega-Cap Comeback
- Source: LPL Research, Bloomberg 09/23/26
- Indexes are unmanaged and cannot be invested in directly. Past performance is no guarantee of future results.
Participation and Price Diverge
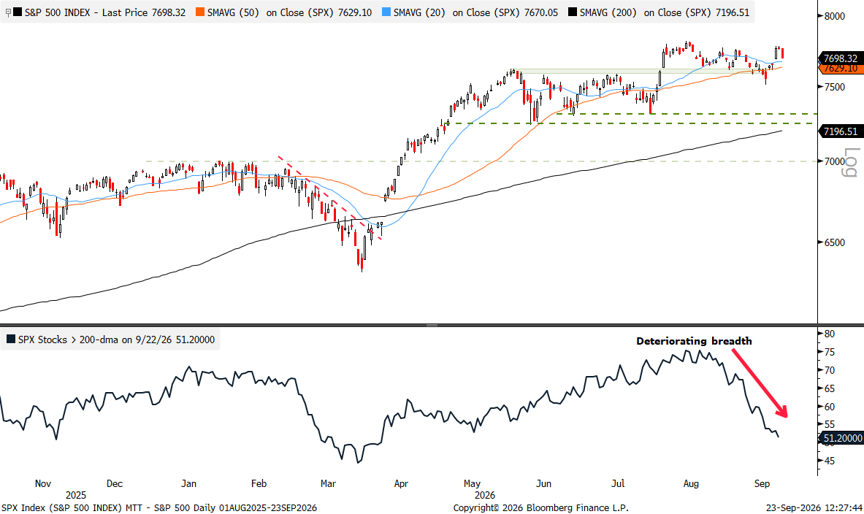
Beneath the surface, the story looks much different. Since the July 28 low, the S&P 500 has gained around 5% and returned to record highs, but breadth has moved in the opposite direction. The percentage of constituents trading above their 200-day moving average has declined from 73% to 51%, a notable deterioration in participation during a period when the index itself has been making new highs. Historically, healthy and sustainable advances have been characterized by expanding participation, with a growing number of stocks confirming the move. The latest rally has instead become increasingly dependent on a handful of mega-cap companies. That dynamic does not necessarily signal an imminent reversal, or suggest investors are abandoning equities, but it does indicate the market's structural support has become increasingly narrow and more susceptible to weakness in its leadership groups.
S&P 500 Holds Near Record Highs as Breadth Deteriorates
- Source: LPL Research, Bloomberg 09/23/26
- Indexes are unmanaged and cannot be invested in directly. Past performance is no guarantee of future results.
Limited New Highs
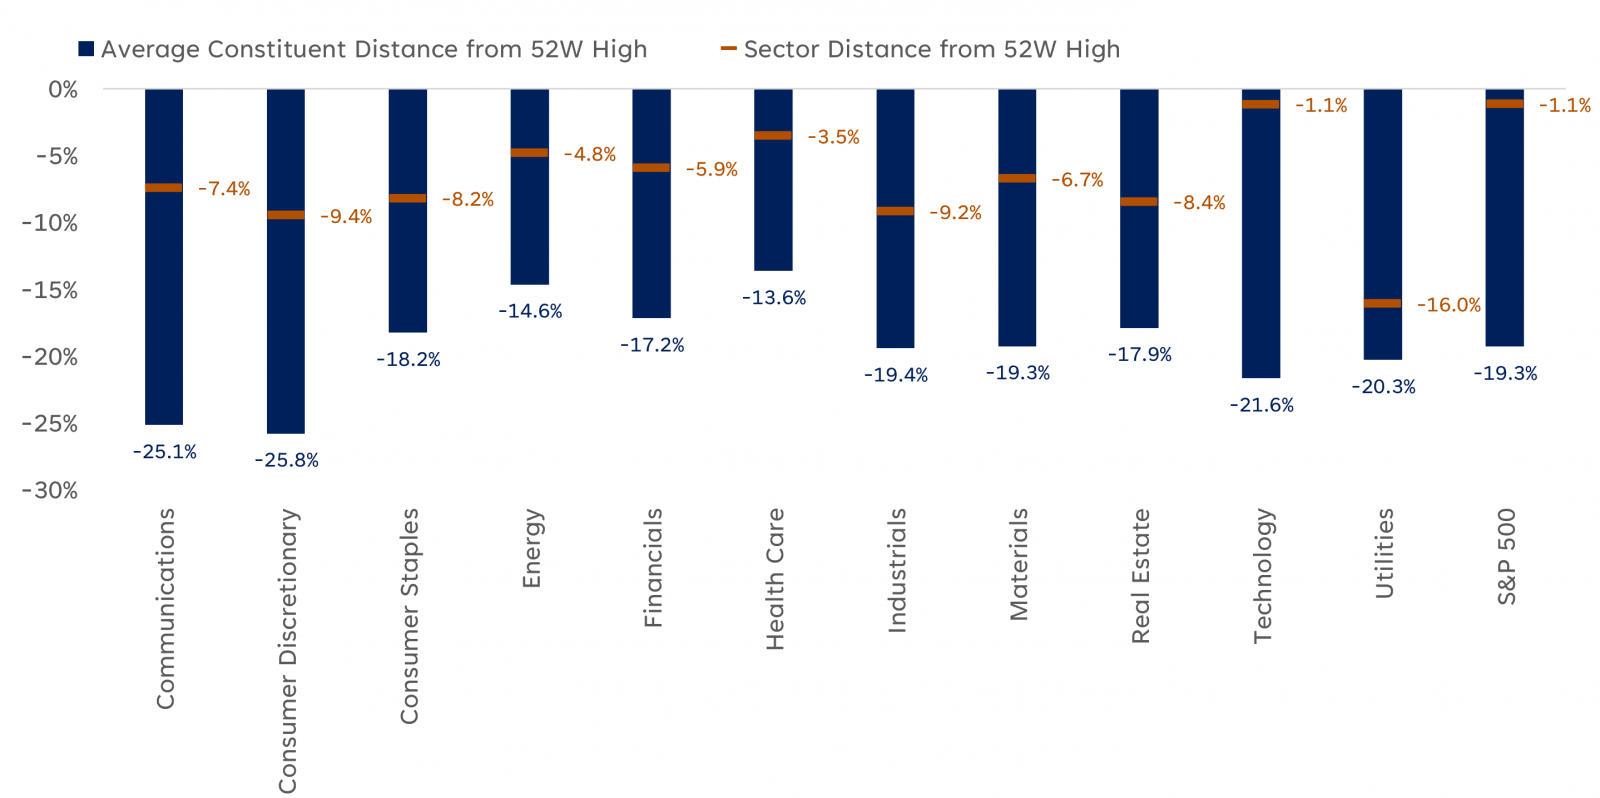
The lack of participation is also evident in new-high data. While the S&P 500 sits around 1% below a record high, the average constituent remains more than 19% away from its own 52-week high. In other words, the typical stock has not kept pace with the index, underscoring the growing gap between headline performance and underlying market strength.
Technology provides the clearest example of this divergence. The sector is less than 1% from a new 52-week high, supported by the outsized influence of a small group of mega-cap leaders tied to the AI theme. Yet the average technology stock remains nearly 22% below its own 52-week high. This disparity underscores just how concentrated leadership has become. While investors continue to reward a select group of companies with strong earnings momentum, AI-related spending tailwinds, and favorable profit outlooks, a much larger portion of the sector has struggled to keep pace.
A Tale of Two Trends: The S&P 500 Index and the Average Stock
- Source: LPL Research, Bloomberg 09/23/26
- Indexes are unmanaged and cannot be invested in directly. Past performance is no guarantee of future results.
History as a Guide
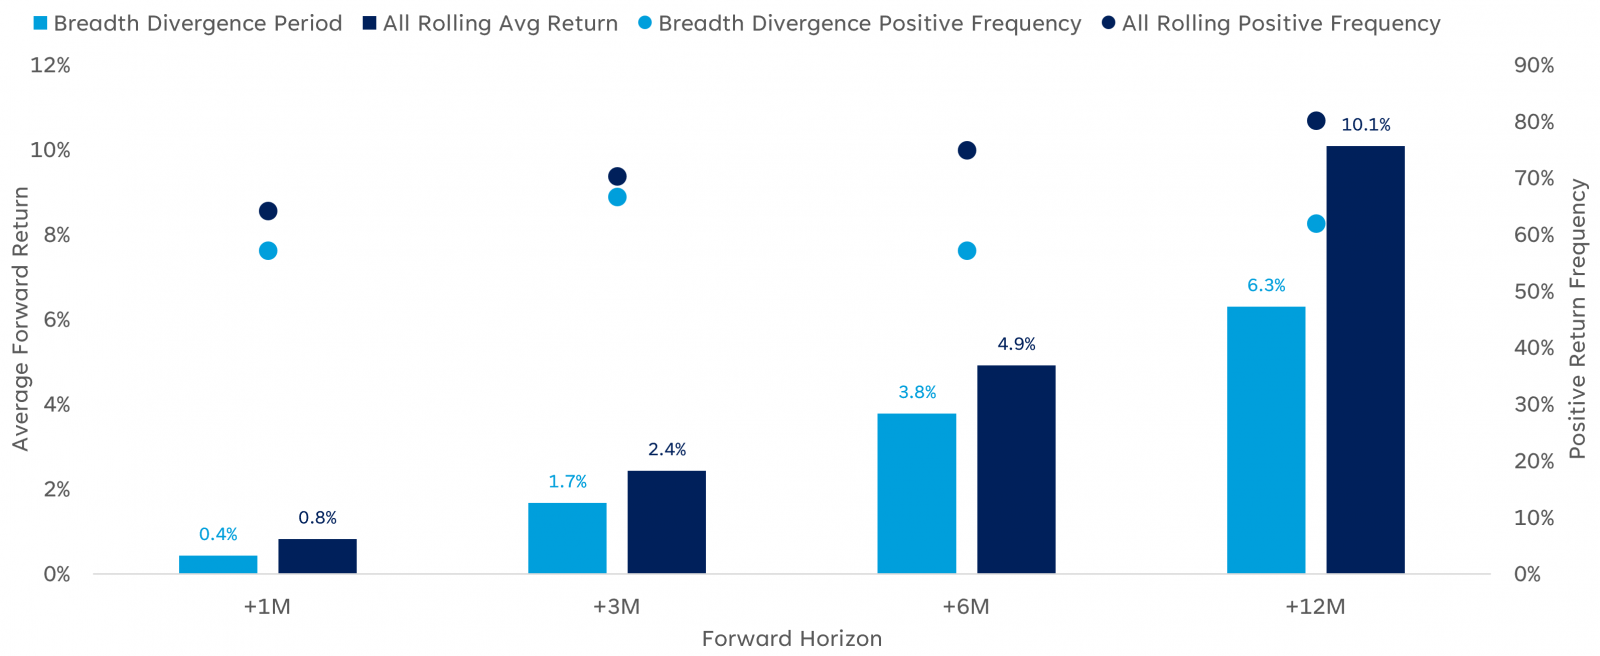
Historical comparisons paint a more nuanced picture. Instances where the S&P 500 has traded near record highs despite weakening participation have generally been followed by positive returns, but the magnitude of those gains has tended to be below average. Filtering for periods when the S&P 500 was within 3% of a 52-week high, fewer than 55% of constituents were trading above their 200-day moving average, and less than 3% of the index was registering a new 52-week high identifies 21 occurrences since 1991. Following those signals, the S&P 500 delivered average returns of 0.4%, 1.7%, 3.8%, and 6.3% over the subsequent one-, three-, six-, and 12-month periods, respectively.
While those forward returns remained positive on average, the frequency of positive outcomes was notably lower than the S&P 500's typical success rate across comparable rolling periods. Importantly, narrow participation did not necessarily mark the end of a bull market, but it often coincided with a less favorable risk-reward backdrop. Markets were generally able to grind higher, though with more frequent bouts of volatility, consolidation, and leadership rotation along the way.
Forward S&P 500 Returns Following Comparable Breadth Divergences
- Source: LPL Research, Bloomberg 09/23/26
- Indexes are unmanaged and cannot be invested in directly. Past performance is no guarantee of future results.
Conclusion
Deteriorating breadth is often viewed as a warning sign that an advance is losing structural support, but history suggests it is better interpreted as a caution flag than an outright sell signal. Throughout the current bull market, breadth divergences have often emerged near important turning points, with mega-cap stocks leading the market off key lows and through major resistance levels before participation broadens to the rest of the index. Whether that pattern repeats itself will be an important test in the weeks ahead. If the major indexes break to new highs without an accompanying improvement in breadth, concerns about the durability of the rally are likely to grow. Conversely, a rebound in participation would help validate the breakout and reinforce the broader bull-market trend.
- Important Disclosures
- This material is for general information only and is not intended to provide specific advice or recommendations for any individual. There is no assurance that the views or strategies discussed are suitable for all investors. To determine which investment(s) may be appropriate for you, please consult your financial professional prior to investing.
- Investing involves risks including possible loss of principal. No investment strategy or risk management technique can guarantee return or eliminate risk.
- Indexes are unmanaged and cannot be invested into directly. Index performance is not indicative of the performance of any investment and does not reflect fees, expenses, or sales charges. All performance referenced is historical and is no guarantee of future results.
- This material was prepared by LPL Financial, LLC. All information is believed to be from reliable sources; however LPL Financial makes no representation as to its completeness or accuracy.
- Unless otherwise stated LPL Financial and the third party persons and firms mentioned are not affiliates of each other and make no representation with respect to each other. Any company names noted herein are for educational purposes only and not an indication of trading intent or a solicitation of their products or services.
- Asset Class Disclosures –
- International investing involves special risks such as currency fluctuation and political instability and may not be suitable for all investors. These risks are often heightened for investments in emerging markets.
- Bonds are subject to market and interest rate risk if sold prior to maturity.
- Municipal bonds are subject and market and interest rate risk and potentially capital gains tax if sold prior to maturity. Interest income may be subject to the alternative minimum tax. Municipal bonds are federally tax-free but other state and local taxes may apply.
- Preferred stock dividends are paid at the discretion of the issuing company. Preferred stocks are subject to interest rate and credit risk. They may be subject to a call features.
- Alternative investments may not be suitable for all investors and involve special risks such as leveraging the investment, potential adverse market forces, regulatory changes and potentially illiquidity. The strategies employed in the management of alternative investments may accelerate the velocity of potential losses.
- Mortgage backed securities are subject to credit, default, prepayment, extension, market and interest rate risk.
- High yield/junk bonds (grade BB or below) are below investment grade securities, and are subject to higher interest rate, credit, and liquidity risks than those graded BBB and above. They generally should be part of a diversified portfolio for sophisticated investors.
- Precious metal investing involves greater fluctuation and potential for losses.
- The fast price swings of commodities will result in significant volatility in an investor's holdings.
- This research material has been prepared by LPL Financial LLC.
- Not Insured by FDIC/NCUA or Any Other Government Agency | Not Bank/Credit Union Deposits or Obligations | Not Bank/Credit Union Guaranteed | May Lose Value
- For Public Use – Tracking: #1180784